Teaching the "Unteachable":
Giving Children with
severe Autism
a voice
Visual communication analysis:
Applying self determination theory to autism
Introduction
Method
Results
Study 1
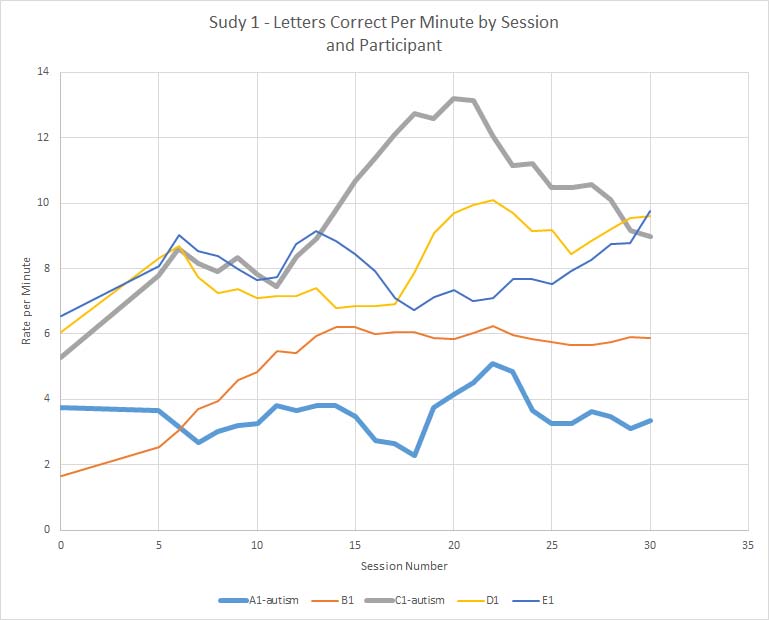
Letters correct per minute were tested with a repeated measures ANOVA with a Huyhn-Feldt correction. F(4.52, 18.09) = 3.948, p = 0015
Participants A1 and C1 had a diagnosis of severe autism and intellectual disability. The three other participants did not have any diagnosis.

Maladaptive Behaviors
Participant | Baseline Behavior count | Final Behavior Count | Percent Decrease |
|---|---|---|---|
A1 - autism | 29.33 | 1.33 | 95.45% |
B1 | N/A | N/A | N/A |
C1 - autism | 12.66 | 0.66 | 94.74% |
D1 | N/A | N/A | N/A |
E1 | N/A | N/A | N/A |
Qualitative Behavior Data
Participant | Baseline Behavior | Number of Initial Therapists Assigned |
|---|---|---|
A1 - autism | Biting, pulling hair, pinching, throwing, licking | 2 + 2 parents |
B1 | N/A | 1 |
C1 - autism | Hitting, pulling, hair, kicking, punching, spitting | 2 |
D1 | N/A | 1 |
E1 | N/A | 1 |
Participant | Qualitative Behavior Change |
|---|---|
A1 - autism | No longer confined to stroller. No headphones or chewy toy |
B1 | More confidence |
C1 - autism | Sleeps in own bed, more verbal |
D1 | More confidence |
E1 | More confidence |
Study 2
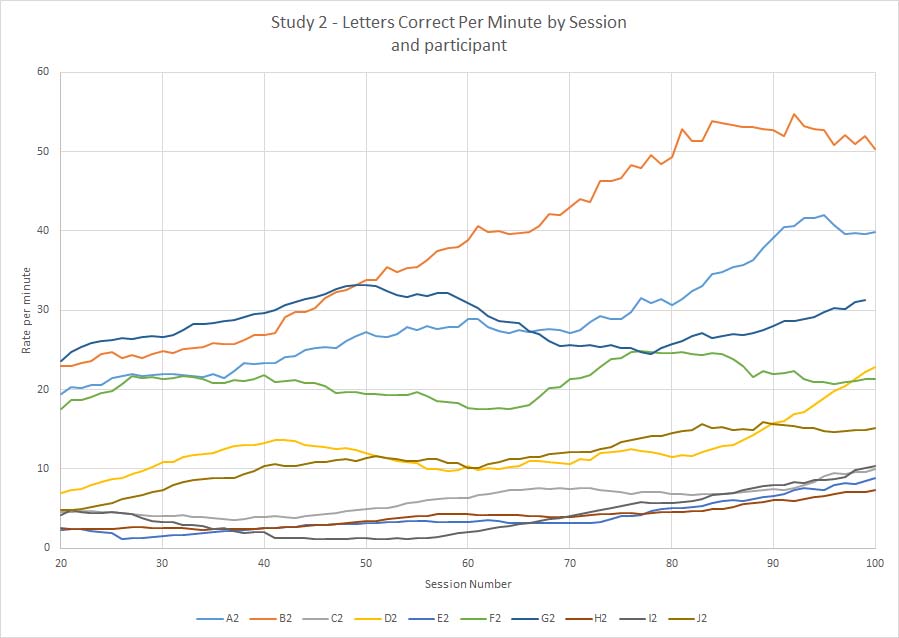
Letters correct per minute were tested with a repeated measures ANOVA with a Greenhouse-Geisser correction. F(2.14, 19.28) = 8.954, p = 0004

Maladaptive Behaviors
Participant | Baseline Behavior count | Final Behavior Count | Percent Decrease |
|---|---|---|---|
A2 | 7.67 | 0 | 100% |
B2 | 7.33 | 0 | 100% |
C2 | 18.67 | 2.00 | 89.3% |
D2 | 28.57 | 2.00 | 93.0% |
E2 | 4.67 | 2.00 | 57.1% |
F2 | 3.33 | 1.00 | 70.0% |
G2 | 46.33 | 1.00 | 97.8% |
H2 | 17.67 | 1.67 | 90.6% |
I2 | 4.00 | 2.33 | 41.7% |
J2 | 11.67 | 0.33 | 97.1% |
Statistics | Baseline Behavior count | Final Behavior Count | Percent Decrease |
|---|---|---|---|
Mean | 15.0 | 1.23 | 91.8% |
Std. Deviation | 13.65 | 0.89 | 0.20 |
There was a significant difference in the scores for baseline behaviors (M=15.0 , SD= 13.65) and the post treatment behaviors (M=1.23, SD=0.98 ); t(8) = , p = 4.1 E-7
Qualitative Behavior Data
Participant | Baseline Behavior | Number of Iniital Therapists Assigned |
|---|---|---|
A2 | Pinching, pulling hair, grabbing, eloping, damage equipment | 2 |
B2 | Hitting, scratching | 1 |
C2 | Hitting, pulling hair, kicking, biting, pinching | 2 |
D2 | Hitting, pinching, pulling hair, scratching, biting | 2 |
E2 | Pinching, pulling hair, spitting, scratching, biting | 2 |
F2 | Hitting, scratching, throwing, eloping, biting | 3 |
G2 | Hitting, pinching, kicking, pulling, biting | 2 |
H2 | Hitting, grabbing, pinching, pulling hair, throwing, kicking, slapping | 2 |
I2 | Hitting, scratching, pinching, biting, throwing, eloping, pulling hair | 2 |
J2 | Hitting, grabbing, pulling hair, biting, eloping, kicking | 3 |
Participant | Qualitative Behavior Change |
|---|---|
A2 | Toilet trained |
B2 | More regular bowel movements, more emerging language |
C2 | Toilet trained, more verbal, No more eating from baby bottle |
D2 | Toilet trained, more verbal |
E2 | Toilet trained, no chewy, no headphones, language emerging |
F2 | More verbal |
G2 | More verbal |
H2 | Toilet trained |
I2 | Toilet trained, language emerging |
J2 | Was able to go back to government school |
Robustness Testing
To test the robustness of Study 2, a combinatorial subgroup repeated measures ANOVA was calculated.
The table attached in the downloadable paper gives the p values for the F test for each subgroup. It should be noted that using an alpha = 0.025 and a Greenhouse-Geisser correction, every ANOVA subgroup test was statistically significant.Researchers hypothesized that with the use of Visual Communication Analysis participants would learn to type independently. As reported above, this hypothesis was supported by the data. In study 1, all five participants learned to type with an average of LCPM 7.52. In study 2, all 10 participants learned to type with an average LCPM of 21.74.
These numbers not only represent learning and accuracy, but also the participants’ success with novel tasks. As displayed in Tables 1 and 2 above, each participant engaged in new tasks and progressively more difficult tasks, during each session, while maintaining a reasonable LCPM. This data challenges traditional approaches to testing and teaching children with Autism. All 12 of the participants from both studies who were diagnosed with Autism Spectrum Disorder were also diagnosed with Intellectual Disability (the Diagnostic and Statistical Manual of Mental Disorders’ (DSM) new classification for Mental Retardation). These participants attended different schools, and were diagnosed by different professionals in different fields. However, with the use of VCA, with a maximum span of 100 sessions, all children showed a remarkable ability to learn and to succeed despite being presented with progressively more difficult and advanced tasks. Another 100 sessions with these children might show continued growth, and their ability to master various skills and information (e.g. fractions, human anatomy, geography, the use of contractions, etc.). This data is great news for parents, professionals and educators alike, as it can inform the child’s actual cognitive abilities, treatment plans and Individualized Education Plans (IEP), and most importantly, give each child a means to communicate through typing.
To read the full paper and the complete results, please download the full paper.
This video was presented at the conference.